Consumer magazines, digital vs. TV ad spend, updated social network demographics, holiday spending projections, and more are among the topics covered in this month’s installment of TFP’s Media Metrics roundup.
To help you keep up with trends and prepare for changes just around the corner, each month we compile excerpts from some key reports covering issues affecting the publishing and media industries. Here are our top picks.
The 2014 Consumer Magazine CEO Survey (Folio)
- While print faces declines, a Folio survey found that print advertising still accounted for 43.6% of all ad revenue in 2013, while digital brought in just 11.3%. And those figures haven’t changed much over the past five years, nor are they expected to move more than 2 percentage points in 2014, the report said.
- Consumer magazines are more profitable than they have been at any time in the past five years: Only 9% of publishers were in the red in 2013, compared with 12.6% over the past five years and a high of 18% in 2012.
- But competition has increased, with one-fifth of respondents reporting that they have more direct competitors now than they did a year ago, a figure that has gone up steadily over the past five surveys. The report noted that competition is growing at a faster rate for smaller publishers compared with larger companies (22% vs. 10%).
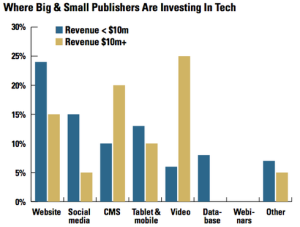
- There’s also a disparity between large and small publishers when it comes to technology investment: Large companies spent more than $315 million on new technology in 2013, while smaller publishers averaged just $25 million (see chart above for a breakdown of the technologies they are investing in).
- In terms of newsstand sales, a third of respondents projected declines, and only 8% said newsstand sales will increase. Overall, an average loss of 2.7% is expected.
Bold Prediction: Digital Passes TV in 2016 (Media Life Magazine)
- Meanwhile, Forrester reported that spending on digital advertising will surpass television spending by 2016, which is sooner than other estimates.
- Digital will grow to $77.101 billion by 2016 and jump to $101.3 billion by 2019, at which time it will account for 36% of ad spending versus 30% for TV.
- It said mobile will account for 66% of digital’s growth over the next five years.
The Demographic Trends For Every Social Network (Business Insider)
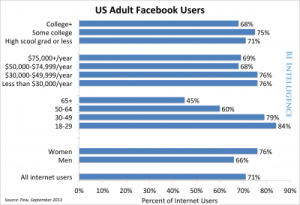
- A BI Intelligence report examining shifts in social media demographics found that women in the U.S. are still more likely to use Facebook over men, by about 10 percentage points, and that more than half of teens surveyed said they have used the social network more this year compared with last year.
- However, it found that teens rated Instagram “most important” and that 83% of teens from wealthy households use that site.
- Among U.S. adults, LinkedIn is more popular than Twitter, with a core demographic of 30- to 49-year-old users in the prime of their careers. Meanwhile, the report cited a Pew survey showing that Twitter is becoming more male-dominated than before: 22% of users are men while only 15% are women.
- Also, YouTube use continues to grow among 18- to 34-year-old viewers. Nearly half in this age group visited the site, which beat out other digital and TV outlets as the top place to watch content.
15 Holiday Retail Stats That Every Marketer Needs to Sees (Adweek)
- Adobe’s annual holiday shopping forecast estimated that 31% of online sales on Thanksgiving will be via mobile. That compares with 21% last year, reflecting a year-over-year increase of almost 48%.
- Across mobile devices and desktops, shopping on Thanksgiving, Black Friday, and Cyber Monday combined is expected to generate about $6.5 billion in sales.
- Some 25% of U.S. consumers will consult social media before buying gifts, and 40% of 18- to 34-year-old shoppers are likely to look for gift ideas on social networks, according to Adobe’s survey.
- Black Friday will be the fastest-growing digital sales day in 2014, bringing in $2.48 billion, a 28% increase over last year.
19% Say They Get News From a Source They Distrust (Pew Research Center)
- In a survey examining political polarization and media habits, nearly two in 10 respondents said they get their news from a source they distrust, whether it’s a cable network, magazine, or website.
- That sentiment is more pronounced among conservatives: Those with consistently conservative (26%) and mostly conservative (25%) political views said they use at least one news source that they distrust. In contrast, just 14% of those with consistently liberal political views and 16% of those with mostly liberal views reported the same.
- Almost half (47%) of respondents with consistently conservative political views cited Fox News as their primary and most trusted news source. Those with consistently liberal political views reported using a wider range of news sources, with no more than 15% naming CNN, NPR, MSNBC, and The New York Times as their primary sources. This group reported trust in all four outlets.
Survey: Publishers Embracing Shift to Time-Based Metrics (Capital New York)
- A Digital Content Next study showed that 80% of publishers are already using time-based metrics to price and sell digital ads, while 20% are planning to do so in the future—16% within the next six months.
- The survey found that 90% of respondents use time metrics to measure the performance of their content internally, but 68% noted that lack of standardization and lack of advertiser interest are obstacles to using the method as an industry benchmark.
- Most publishers said they use more than one company for time-based metrics, including ComScore, Adobe Omniture, Moat, and Chartbeat.
Study: People Prefer Apps With Ads to Premium Apps (Media Life Magazine)
- According to a Digital Advertising Alliance survey, 58% of respondents would rather get their apps for free than pay for them.
- It also found that only 8% would download their apps again if they had to pay for them, while 46% said they wouldn’t do so.
- Some 71% said they look for tools with transparency and choice in terms of relevant ads and data collection.
- A majority of respondents (66%) noted that such tools should let them pick which brands advertise relevant offers.
Adobe Report Finds Massive 43% Growth in Online Video Watching (VentureBeat)
- A recent report said users viewed 38.2 billion free videos online in the second quarter this year, a 43% jump over the same period a year ago.
- Nearly three-fifths of those videos were viewed on smartphones.
- Video advertising spend rose 25.8% over the same period last year, with an average of two video ads per each free video viewed.
- Unique monthly visitors to video sites increased by 146% year over year.
- The study also found that online TV show viewership via authenticated viewing increased 388% year over year, with an 85% jump in the number of viewers.
Where’s the Mobile Ad Money Coming from Next Year? (eMarketer)
- An eMarketer survey found that U.S. advertisers will increase spending on mobile ads by 78% this year, to almost $19 billion.
- While 38% of respondents said they planned to increase their budgets to fund more mobile spending, some ad dollars will come out of print (40%), TV (34%), and even digital budgets (33%).
- In the U.S., mobile spending will grow 78% this year and 50% next year.
- By 2018, mobile ad expenditures in the U.S. will increase 20%, bringing the total to $58.78 billion.
Media Metrics is a monthly feature from Technology for Publishing, aimed at keeping you armed with the latest industry data. If you’d like to share something you’ve read, drop us a note. And keep up with the latest industry news coverage by signing up for our This Week in Publishing emails or our monthly Publishing Trends newsletter.
Posted by: Margot Knorr Mancini


