A scorecard of top publishers’ social media activity, what news organizations are focusing on most, where the different generations are getting their political news, media and entertainment spending, and more are covered in this month’s installment of TFP’s Media Metrics roundup.
To help you keep up with trends and prepare for changes just around the corner, each month we compile excerpts from some key reports covering issues affecting the publishing and media industries. Here are our top picks.
Report: Top Publishers Saw 15% Engagement Growth on Instagram in April (Social Times)
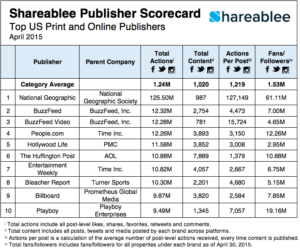
- According to the Shareablee Media Publishing Social Scorecard, there were 783 million social media actions driven by media publishers in April, with 524 million on Facebook, 35 million on Twitter, and 224 million on Instagram.
- Entertainment Weekly saw the most social engagement growth of the publishers in the top 10, with a 43% increase since March. Meanwhile, People.com moved up to the No. 4 spot with a 34% increase, with growth rates of 130% on Facebook, 98% on Twitter, and 243% on Instagram.
- BuzzFeed Video ruled Facebook with 11.93 million actions, followed by Hollywood Life with 11.23 million. National Geographic grew 23% in total social engagements, leading on Instagram with over 115.58 million actions. Bleacher Report pulled ahead on Twitter with over 1.80 million engagements.
Survey: News Orgs Are Prioritizing Mobile Development and Placing Less Emphasis on Paywalls (Niemen Lab)
- An annual survey at the International News Media Association World Congress found digital growth is now the top priority among news organizations, with 94% of respondents citing it as critical or very important.
- That was followed by mobile development (93%), data analytics (92%), and growing mobile revenue streams (91%).
- However, the percentage of publishers who said paywall development is a priority fell by almost half compared with last year’s survey.
Study: Facebook Main Source of Political News for Millennials, Gen X-ers (Politico)
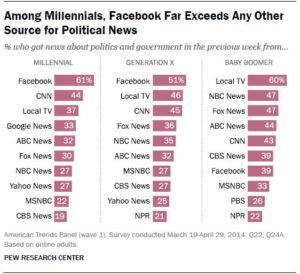
- A recent Pew Research survey found that 61% of millennials get their political news from Facebook, compared with 37% who said they watch local television news.
- Conversely, 60% of baby boomers said they get their political news from local television, while 39% reported that they find it on Facebook.
- The report also showed that after Facebook, the most common source of political news for millennials is CNN, followed by local television. For Gen Xers, Facebook and local television are top sources, while baby boomers most often turn to local television, NBC News, and Fox News.
Media, Entertainment Spending to Remain Healthy (Media Post)
- A recent PwC report projected global entertainment and media spending will increase to $2.23 trillion by 2019, up from $1.74 trillion in 2014. The U.S. market alone will reach $723 billion, an increase from $568 billion last year.
- Over the next five years, it estimated digital spending will see a growth rate of 11%, making up 46% of overall entertainment and media spending, up from 34% last year.
- U.S. advertising revenues are expected to jump to $230 billion in 2019, from $194 billion in 2014. The report noted the biggest growth will come from Internet and video game advertising.
B-to-B Media Revenue Hits $27.6 Billion—a Six-Year High (Advertising Age)
- According to the Association of Business Information and Media Companies, B2B media and information revenue last year rose to its highest level since 2008, increasing 3.3% over 2013 to $27.6 billion.
- Digital ad revenue increased 15% last year, to $5.8 billion, making up more than 20% of revenue in the B2B industry. Revenue from display advertising now lags that of native advertising, content marketing, and marketing services, the fastest-growing areas in digital advertising.
- The report said the data and business information category last year hit $2.8 billion, a year-over-year increase of 4.2%, making it the second-fastest growing segment.
- Still bringing in the most B2B revenue is events, increasing by 1.8% last year to $12.2 billion, while B2B print advertising fell 2.7% to $6.7 billion.
The Global Smartphone Market Report: Forecasts, Vendor and Platform Wars, and the New High-Growth Markets (Business Insider)
- A BI Intelligence report estimated that global smartphone shipments increased 29% last year, surpassing the 1 billion mark for the first time.
- It projected the market will almost double to 2 billion next year. By 2020, global shipments of smartphones are expected to reach 3.4 billion.
- India is the new growth market, with smartphone shipments projected to increase 31% per year on average through 2020, compared with an average 8% annual growth rate in China in the same period.
- Following the release of iPhone 6, Apple increased its Q4 market share 8 percentage points from a year earlier, bringing down Android’s share to 77%, the report said.
U.S. Digital Ad Spending Will Approach $60 Billion This Year, with Retailers Leading the Way (eMarketer)
- The latest numbers from eMarketer project that digital ad spending in the U.S. will hit $58.61 billion this year, with retailers spending the most: 22% of the total, or $12.91 billion—far more than other industries.
- The report, which looks at digital ad spending by industry, found automotive and financial services will take the No. 2 and 3 spots, at 12.5% and 12.3%, respectively.
- Retailers will spend $6.65 billion on mobile advertising this year, twice as much as any other industry. That figure represents 23.2% of the $28.72 billion U.S. advertisers are expected to spend this year on mobile, it said.
Most Americans Want More Privacy, Don’t Trust Advertisers, Social Media or Search (Marketing Land)
- A Pew Research survey found that while most respondents (90%) said being able to control their online information and who can access it is important, they don’t have high expectations when it comes to online protections and privacy.
- The survey found that almost 80% of respondents don’t believe that online advertisers can be trusted with their information, and almost 70% don’t trust social media sites to protect their data. A majority (66%) said they don’t think their search activity records are private and secure either.
- However, in work environments, only 56% said there’s an expectation of privacy.
The Internet Pushes Individual Media Use to More Than 8 Hours a Day (Adweek)
- A recent report from ZenithOptimedia projected that worldwide Internet use will rise 12% this year, pushing average individual media consumption to more than eight hours per day.
- It said by 2017, the Internet will account for 29% of the time users spend consuming media.
- Since 2010, the amount of time people spend on the Internet per day has almost doubled, from about 60 minutes to an hour and 49 minutes today.
Time Spent Reading Newspapers Worldwide Falls Over 25% in Four Years (Guardian)
- The ZenithOptimedia report also found that from 2010 to 2014, the average amount of time people spent reading newspapers fell more than 25%, although in the same time frame the decline was just 3% in the U.K.
- Worldwide, the average time people spent reading newspapers last year was 16.3 minutes per day, down from a daily average of 21.9 minutes in 2010.
- The report said that by 2017, the global average will drop to 14.1 minutes a day, a 35% decrease from 2010.
Worldwide Newspaper Circulation Revenues Pass Advertising for the First Time (Poynter)
- According to a survey by trade group WAN-IFRA, global newspaper circulation revenue has for the first time topped that of advertising, generating $92 billion vs. the latter’s $87 billion.
- Among other findings, print still brings in 93% of revenues and is expected to be “the major source of revenue for years to come.”
- Worldwide, 2.7 billion people read newspapers in print, with an additional 770 million readers on desktop digital platforms and a growing combined print and digital audience.
- Last year, print circulation rose 6.4%, with the strongest gains in India along with growth in Latin America, the Middle East, and Africa. However, print advertising fell 5.2% in 2014, with the largest decreases in North America (7.5%), Asia (6.5%), and Europe (5%).
Media Metrics is a monthly feature from Technology for Publishing, aimed at keeping you armed with the latest industry data. If you’d like to share something you’ve read, drop us a note. And keep up with the latest industry news coverage by signing up for our This Week in Publishing emails or our monthly Publishing Innovations newsletter.
Posted by: Margot Knorr Mancini


