What consumers demand from digital content, how the mobile web is keeping pace with apps, millennials willing to pay for news, and more are covered in this installment of TFP’s Media Metrics roundup.
To help you keep up with trends and prepare for changes just around the corner, each month we compile excerpts from some key reports covering issues affecting the publishing and media industries. Here are our top picks.
Report: What Consumers Want From Digital Content (Social Times)
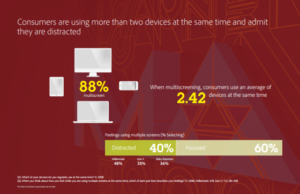
- According to an Adobe survey, nine out of 10 respondents “multiscreen,” although 47% of millennials and 40% of respondents overall indicated they feel distracted while using multiple screens.
- Some 73% said content “must display well on the device,” noting that they are turned off by images that either won’t load or load too slowly, content that’s too long, and unattractive content.
- The survey found 46% of respondents switch devices when the experience is poor, and 39% “just stop engaging.”
The Mobile Web Is Alive and Well (The Wall Street Journal)
- Despite reports to the contrary, recent Millward Brown Digital research shows the mobile Web is keeping pace with apps: More than 59.2% of 20,000 study participants viewed the 30 most-visited sites via a mobile browser, while 60.3% visited through an app.
- It found that 61% accessed their mobile browsers at least once a day for an average of 31 minutes.
- While more than half of participants reported they have 40 to 70 apps on their smartphones, 43% use only four to six a day and 28% use only one to three a day.
Most Millennials Are Willing to Pay for Content,  But Not So Much for News (Nieman Lab)
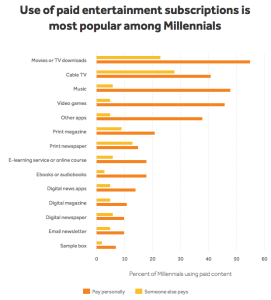
- The Media Insight Project found that 93% of millennials regularly consume paid content, whether they’re paying for it or someone else is, while 87% said they have personally paid for content and services (including Netflix, iTunes, and the like).
- However, only 40% reported they have paid for news products or services.
- More research participants said they pay for print magazines (21%) and newspapers (15%) compared with digital magazines (11%) and online newspaper content (10%).
- Compared with those who don’t pay for news, paying consumers are more likely to follow sports (56% vs. 44%) and current events (51% vs. 38%).
Facebook Messenger Is the 2nd Most Popular App in the U.S. (Social Times)
- ComScore data on the most popular mobile apps shows Facebook Messenger is second only to Facebook itself.
- Facebook has a 73.3% reach with the 191.4 million smartphone owners in the U.S., while Facebook Messenger has a 59.5% reach.
- YouTube is the third most popular mobile app with a 59.3% reach.
- The top 15 list also includes several Google and Apple apps, most likely due to the presence of Android and Apple operating systems on phones, the report said.
Facebook Increases Share Of Ad Budgets, $12B Forecast In 2017 (eMarketer)
- By 2017, Facebook is projected to take in approximately $12.14 billion in U.S. digital ad revenue, according to researcher eMarketer.
- The social media company is expected to grow its share of digital spending from 13.2% in 2015 to 16.1% in 2017.
- Meanwhile, market leader Google will see its share of the total digital ad market decline from 40.1% to 35.4% during the same period, the report said.
5 Charts: How Brands and Publishers Are Using DMPs Globally (Digiday)
- In a recent survey, 53% of media sellers and 43% of media buyers reported they have installed a data management platform (DMP), mostly within the last 12 months.
- A quarter of media buyers said their main reason for implementing a DMP was to “improve ROI for marketing and advertising activities.”
- More than half (55%) of media sellers said they installed a DMP to integrate customer data, and 52% said they did so for more control over their data, enabling them to “set their own prices for their inventory and maintain yields.”
- However, 76% of media buyers said they would rather use a third party provider than build their own DMP technology, while 63% of media sellers reported the same, though each side indicated different reasons for that, according to the report.
Carat Cuts 2015 Global Ad Spend Forecast (MediaPost)
- Carat has revised its 2015 global ad spending forecast to 4% growth, or $529 billion. That’s down from an earlier estimate of 4.6% growth.
- In the U.S., it now expects 2015 ad spending growth to be 4.3% instead of the 4.6% it predicted in March, and 4.5% next year, a drop from an earlier projection of 4.7%.
- Digital, however, is expected to grow 15.7% this year and 14.3% next year. The report said that growth will be driven by a surge in mobile and online video advertising, heavily social media-based, with 51.2% and 22% growth predicted this year.
Millennials are not big cord-cutters (Media Life Magazine)
- According to a study by Evercore, most millennials have no plans to cut the pay TV cord: Only 10% said they plan to do so anytime soon, and less than 20% of respondents said they’ve cut the cord already.
- Of three millennial groups (ages 18-23, 24-29, and 30-35), 50% or more respondents said they are unlikely or somewhat unlikely to choose online streaming over pay TV packages.
- The study found consumers across millennial groups are willing to pay for entertainment, noting Netflix is the No. 1. online video site, followed by YouTube.
Big Publishers’ Fraud Rate is 2.8%, Wider Web’s is 11%, Studies Say (The Wall Street Journal)
- Research commissioned by online publishing trade group Digital Content Next (DCN) found that across member sites, “sophisticated bots” drove an average of 2.8% of traffic to display ads and 2.5% of traffic to video ads.
- In comparison, bots made up an average of 11% of traffic to display ads and 23% of traffic to video ads in participating advertisers’ campaigns, according to an Association of National Advertisers study.
- The report said bot rates for individual DCN member sites ranged from 1.6% to 6.9%.
Tech Giants Top Best Global Brands List (The New York Times)
- Apple and Google are at the top of the annual Interbrand Best Global Brands list for the third year in a row, with values of $170.3 billion and $120.3 billion, respectively.
- Apple’s value grew 43% from last year, while Google saw a 12% increase.
- The report said the tech industry “dominated” the Interbrand list this year, accounting for more than a third of its total value.
Fact Is, People Still Trust Advertising (Media Life Magazine)
- In a recent Nielsen survey, more than half of consumers polled said they trust traditional advertising across media, including TV, magazines, billboards, and radio. Respondents gave all seven of the offline ad formats included in the survey higher ratings compared with those for digital ads.
- TV advertising was high on the trust scale, with 63% of respondents saying they trust it somewhat or completely, a 1 percentage point increase over survey results in 2013.
- Online, video ads had the highest rate of trust (48%), while text ads on mobile devices came in the lowest (36%).
- The report said millennials gave 18 of the 19 categories surveyed the highest level of trust in advertising, including TV, magazines, and newspapers, suggesting the demographic can be reached with the right types of advertising.
Media Metrics is a monthly feature from Technology for Publishing, aimed at keeping you armed with the latest industry data. If you’d like to share something you’ve read, drop us a note. And keep up with the latest industry news coverage by signing up for our This Week in Publishing emails or our monthly Publishing Innovations newsletter.
Posted by: Margot Knorr Mancini


