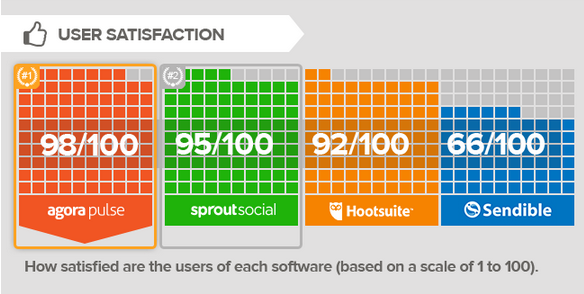
What works for you? As the Seriously Social blog points out, social media management tools can’t take the place of a solid strategy and good planning, but they can boost your productivity and increase the effectiveness of your social media activities. Question is, which is ...
Quality counts. It doesn’t matter how much content you churn out—if it isn’t high quality and relevant to your audience, you’re wasting your time and (often scarce) resources. We discovered an infographic from Express Writers that’s packed with information that can help you ensure a return ...
Not a morning person? Read on. This week our focus is on productivity with a fun “do this, don’t do that” infographic that shows you how to “super-charge” your mornings. Noting that good morning habits are key to highly productive, low-stress workdays, our ...
Adobe MAX, Twitter Announcements, Medium Updates, Google’s Accelerated Mobile Pages, TFP’s Infographic Pick of the Week, DPS 2015 Tip: Migrating Content from DPS Folios, Adobe Digital Publishing Solution v2015.5 Release Welcome to Technology for Publishing’s roundup of news and tips for media industry ...
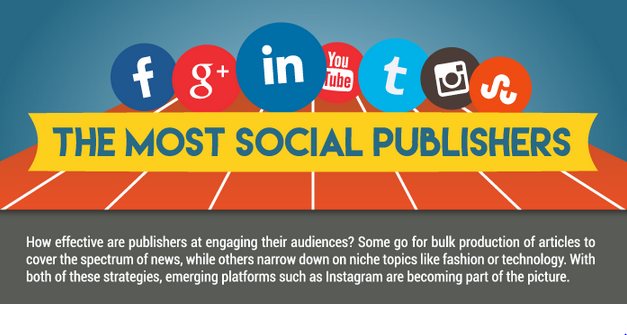
Who’s winning the race? The news business is undoubtedly changing—and rapidly—as more and more readers turn to social media to find the stories of the day. Publishers of all sizes are responding to this shift, with varying strategies and varying degrees of success, according to ...
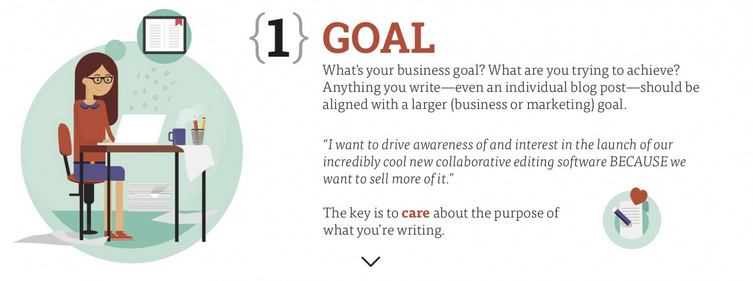
Keep calm and write on. The name of the game today is engagement, which means gaining—and holding—the attention of your audience with content that’s useful and well written. To help you achieve that goal, this week we bring you an infographic that highlights the ...
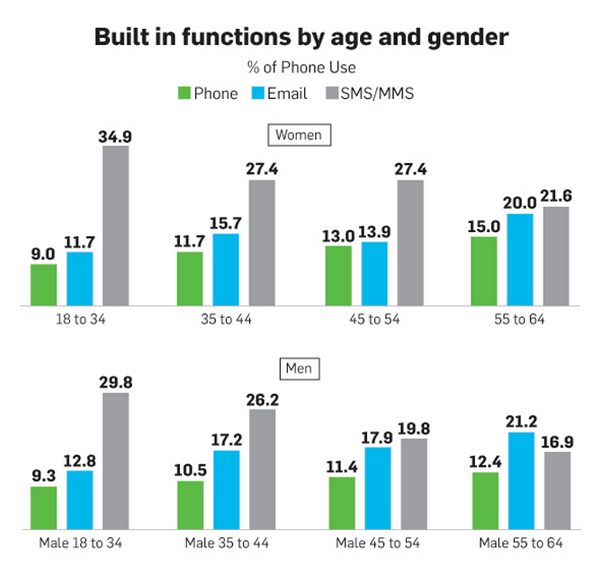
Text me. Many people assume texting is predominately the domain of younger smartphone users, but according to research firm RealityMine, not so. In a recent study of 3,000 users, it found that texting is now the preferred method of communication across generations, ...
Who’s your target? Courtesy of Sprout Social, we bring you some fresh insights on who’s using which social platforms so you can better focus your content efforts. This week’s infographic provides recent demographics for top sites like Facebook, Twitter, Instagram, and others, breaking out usage based ...
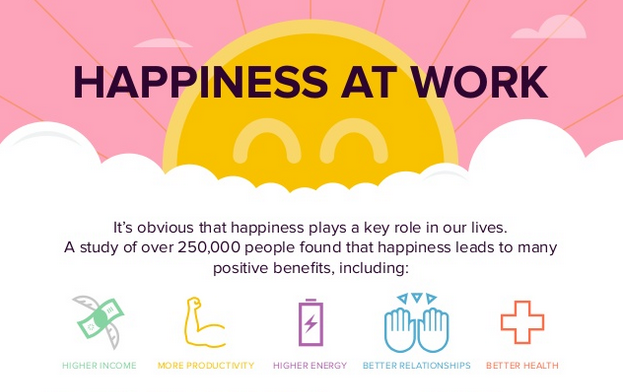
Road to success. “It’s not success that causes happiness, but being happy that tends to lead to success.” Some wise words, highlighted in our Infographic Pick of the Week from Lynda.com, which looks at the many benefits of being content in your work ...
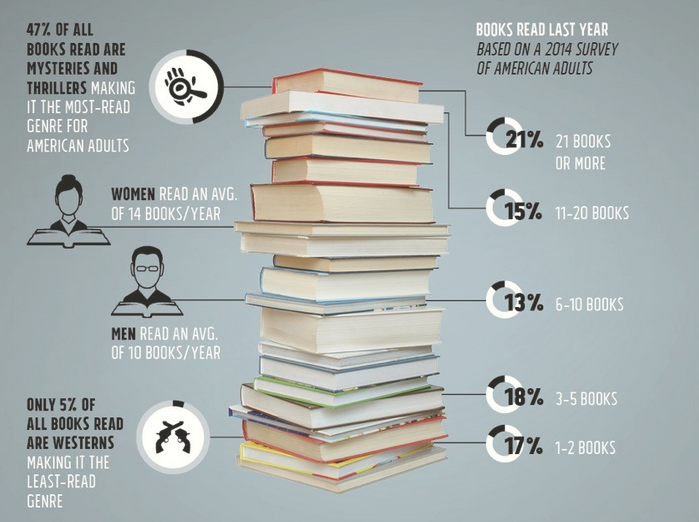
Read much? To mark National Book Lovers Day last month, H&R Block created this week’s infographic pick highlighting the reading and book buying habits of U.S. consumers. From who reads the most books to the most and least popular genres to states that ...
Slow Journalism, Mobile Revenue Gap, TheAtlantic.com Blog, Idealliance “Going Mobile” Event, Adobe’s AEM Workshop, Extensis Font Seminar, Surviving as a Designer in a Digital World, Infographic Pick of the Week, InDesign CC Tip: Embed Publish Online Documents in Websites, Adobe Digital ...
Moving target. What’s a “super-influential consumer,” and what do people in this audience category have in common? According to this week’s infographic pick from TEN, The Enthusiast Network, they’re car-crazy, sports-obsessed, magazine-reading explorers who love to share their opinions about their interests and related products in reviews and ...
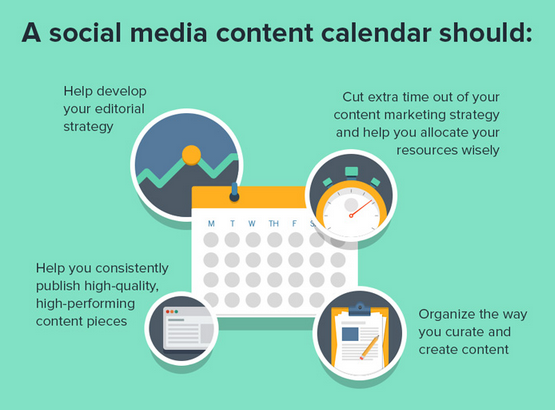
Stop the madness! All over the map with your social media activities? If so, it’s likely your content strategy—including your ability to accurately measure return on investment—is missing its mark. To help you get a handle on things, this week we bring you an infographic ...
Mobile News Alerts, Article Progress Bars, Google Reorg, Allrecipes’ Rate Base Jump, Idealliance “Going Mobile” Briefing, Media Metrics, TFP’s Infographic Pick of the Week Welcome to Technology for Publishing’s roundup of news and tips for media industry pros! This week, ...
Got email? In the business world, there’s no getting around the need to network effectively. That means building relationships, often starting with a single email conversation. Question is, what’s the best way to take that first step? Our Infographic Pick of the Week ...
Publishers’ Mobile Tactics, What’s News App, Ad Blocking Tech, New Vjoon Release, Idealliance “Going Mobile” Briefing, TFP’s Infographic Pick of the Week, InDesign CC Tip: Graphic Cells in Tables Welcome to Technology for Publishing’s roundup of news and tips for media ...
The clock is ticking. When it comes to Facebook posts, the bulk of activity can most often be measured in minutes, not hours or days, according to this week’s infographic from Fanpage Karma, the maker of a social media analytics and monitoring tool. Its analysis of ...
All-New Adobe DPS, Homepage Design, Publishers’ CMS Strategies, Lessons From Facebook’s Mobile Growth, TFP’s Margot Knorr Mancini: Adobe Launches Digital Publishing Solution, TFP Infographic: How Adobe Digital Publishing Solution Works, Publishing Strategy: What’s Most Important Now, Color Therapy, InDesign CC Tip: Publish Online, ...
Sale of the Financial Times, Atlantic Media’s Membership Drive, the Problem With Advertisers, Rules at Gawker and Reddit, TFP’s July Book Picks: Leaders and Visionaries, TFP’s Infographic Pick of the Week, InDesign CC Tip: Publish Online, Part 1 Welcome to Technology for Publishing’s ...
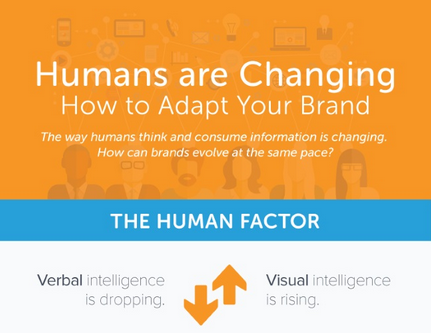
Living in a visual world. There’s no question that the media landscape is becoming increasingly visual, and given that trend, the way we consume information is changing too. Indeed, as this week’s infographic from WebDAM shows, our verbal intelligence is decreasing at the same time our visual ...