Every summer I try to read one really good biography about a leader or visionary, and ideally, something related to publishing. Given summertime is more relaxed, I find it’s a great season to open the mind a bit to explore someone ...
Java, C++, or Python? Many of our daily activities are now dependent on some kind of software, yet most users know little about the way it works. In fact, Bloomberg just highlighted the need to make programmming languages like Java, C++, and Python more accessible to ...
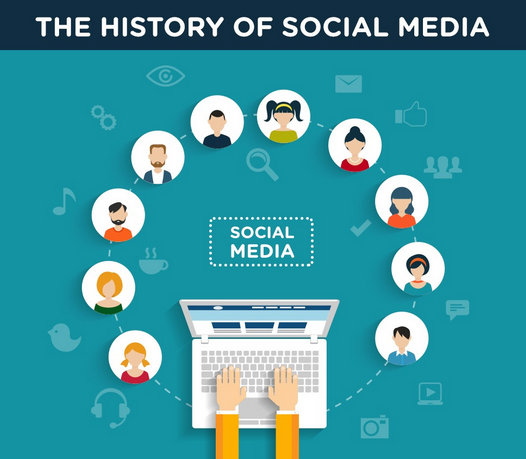
Can we chat? While social media is often thought of as a recent phenomenom, it’s actually been around since the 1970s, starting with newsgroups like Usenet and the BBS (Bulletin Board System). Later, in the ’80s, the first chat groups and online portals launched, ...
A jump in brand content engagement rates, the declining tablet market, growth in book and journal publishing, and more are covered in this month’s installment of TFP’s Media Metrics roundup. To help you keep up with trends and prepare for ...
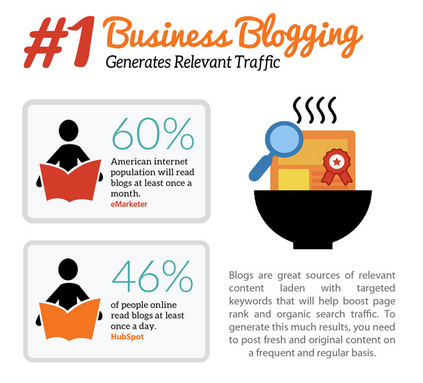
Write on. According to a HubSpot report, 81% of digital marketers see blogging as a critical business process and at least 46% of Internet users read blogs at least once a day. Those are some big numbers, highlighting how essential blogging is to successful ...
I’ve always been intrigued by how one can best convey the essence of a large set of facts and information in a visual way that has immediate impact (see our recent article from TFP Creative Director Mary Lester on Tools for ...
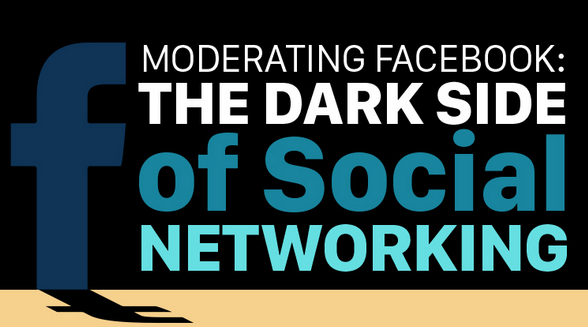
Let’s be careful out there. It can be tough out in the social media streets, where trolls are lurking around every corner. But as you likely know, some sites are worse than others. Why is that? Lack of policing, according to this week’s infographic from WhoIsHostingThis, ...
This week in New York, vjoon met with over 120 of its publishing clients at its vjoonity event. Attendees learned about exciting new features that continue to enhance vjoon K4. K4 and DPS Sneak Peek Publishing users got a sneak peek at Adobe Digital ...
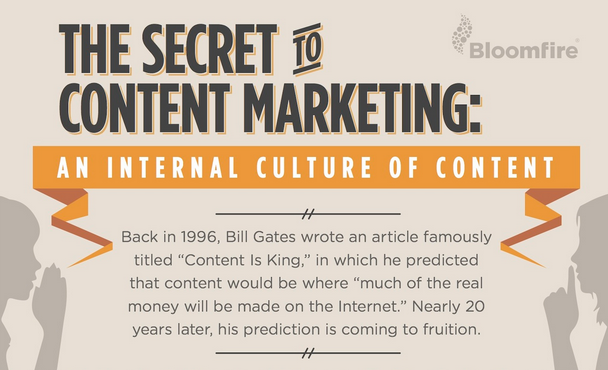
Ready, set, write. As this week’s infographic from Bloomfire points out, Bill Gates was spot on with his 1990s “Content Is King” article. Yet in 2015, many organizations are still struggling to find the key to content success. What are they missing? A ...
For everyone in the content business today, data visualization is key—not only because it’s central to effectively telling stories and building brands, but also because it helps strategists see trends and patterns to better target audiences. But data without the means to ...
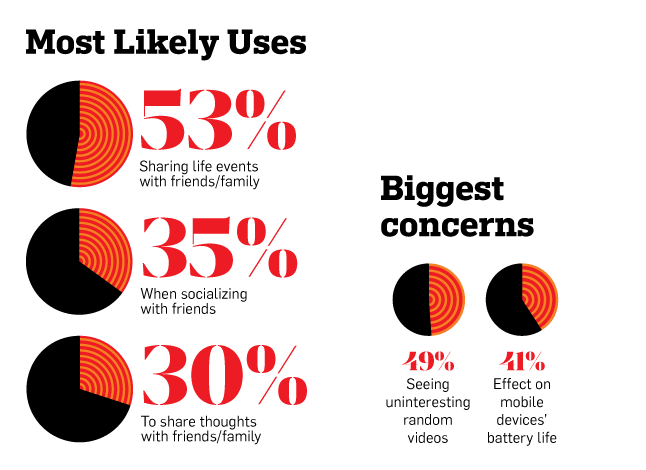
Periscope or Meerkat? There’s been a lot of buzz around live-streaming Twitter app Periscope and rival Meerkat, but who’s really using these apps and for what? This week’s infographic from Adweek, based on a poll by Horizon Media’s WHY Group, takes a ...
A scorecard of top publishers’ social media activity, what news organizations are focusing on most, where the different generations are getting their political news, media and entertainment spending, and more are covered in this month’s installment of TFP’s Media Metrics ...
Who’s reading what? Here’s an infographic jam-packed with facts and figures on how different generations consume digital content, providing a breakdown by baby boomer, millennial, and Generation X users. Based on a survey of 1,200 people, this week’s pick from Fractl and Buzzstream, posted on Social Times, looks ...
Where are the dollars being spent? Our infographic pick this week, brought to you by Direct Marketing News, shows 61% of respondents are increasing their paid media budgets, 67% are boosting owned media budgets, and a whopping 71% plan to ...
What are you wearing? No longer considered nerd gear, wearable tech is big among fitness-minded users for tracking and customizing health and training information and goals. But fashion still counts—and that’s true for men as well as women, according to this week’s infographic, based on a ...
Well, the day has come and passed—the Apple Watch release day. I ordered mine on the prerelease date and had high hopes that I might see it on April 24, but the shipping info indicated that I might not see it ...
Ahead of the launch of the Apple Watch, some analysts estimated that by the end of 2015, shipments of Apple’s first wearable will reach more than 13.7 million units, giving the company a nearly 50% share of the market out of the ...
Why use hashtags? And where do they work best? This week’s infographic pick from SurePayroll addresses those questions and offers some best practices for successful hashtag campaigns. As you likely know, hashtags are an easy way to find and follow conversations and track promotions ...
Pew’s annual report on the state of the news media, video advertising on smartphones and tablets, multiscreen viewing, email fail, and more are covered in this month’s installment of TFP’s Media Metrics roundup. To help you keep up with trends and ...
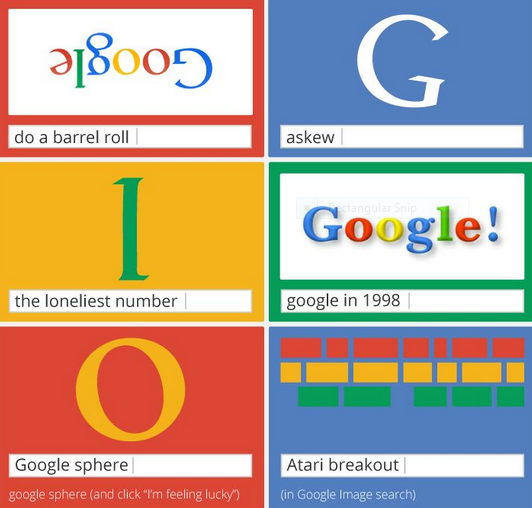
Want to be a Google power user? This week’s infographic, shared by Neomam Studios on Imgur and Ebook Friendly, offers a number of handy tips and techniques that can help you improve your everyday searches and work smarter. To get visually rich Google search ...